Detect Memory Corruption Bugs: Signals, Tools and Hidden Blind Spots
Memory corruption manifests as silent state drift and control flow hijacking, often hiding in valid-looking logs until a crash occurs.

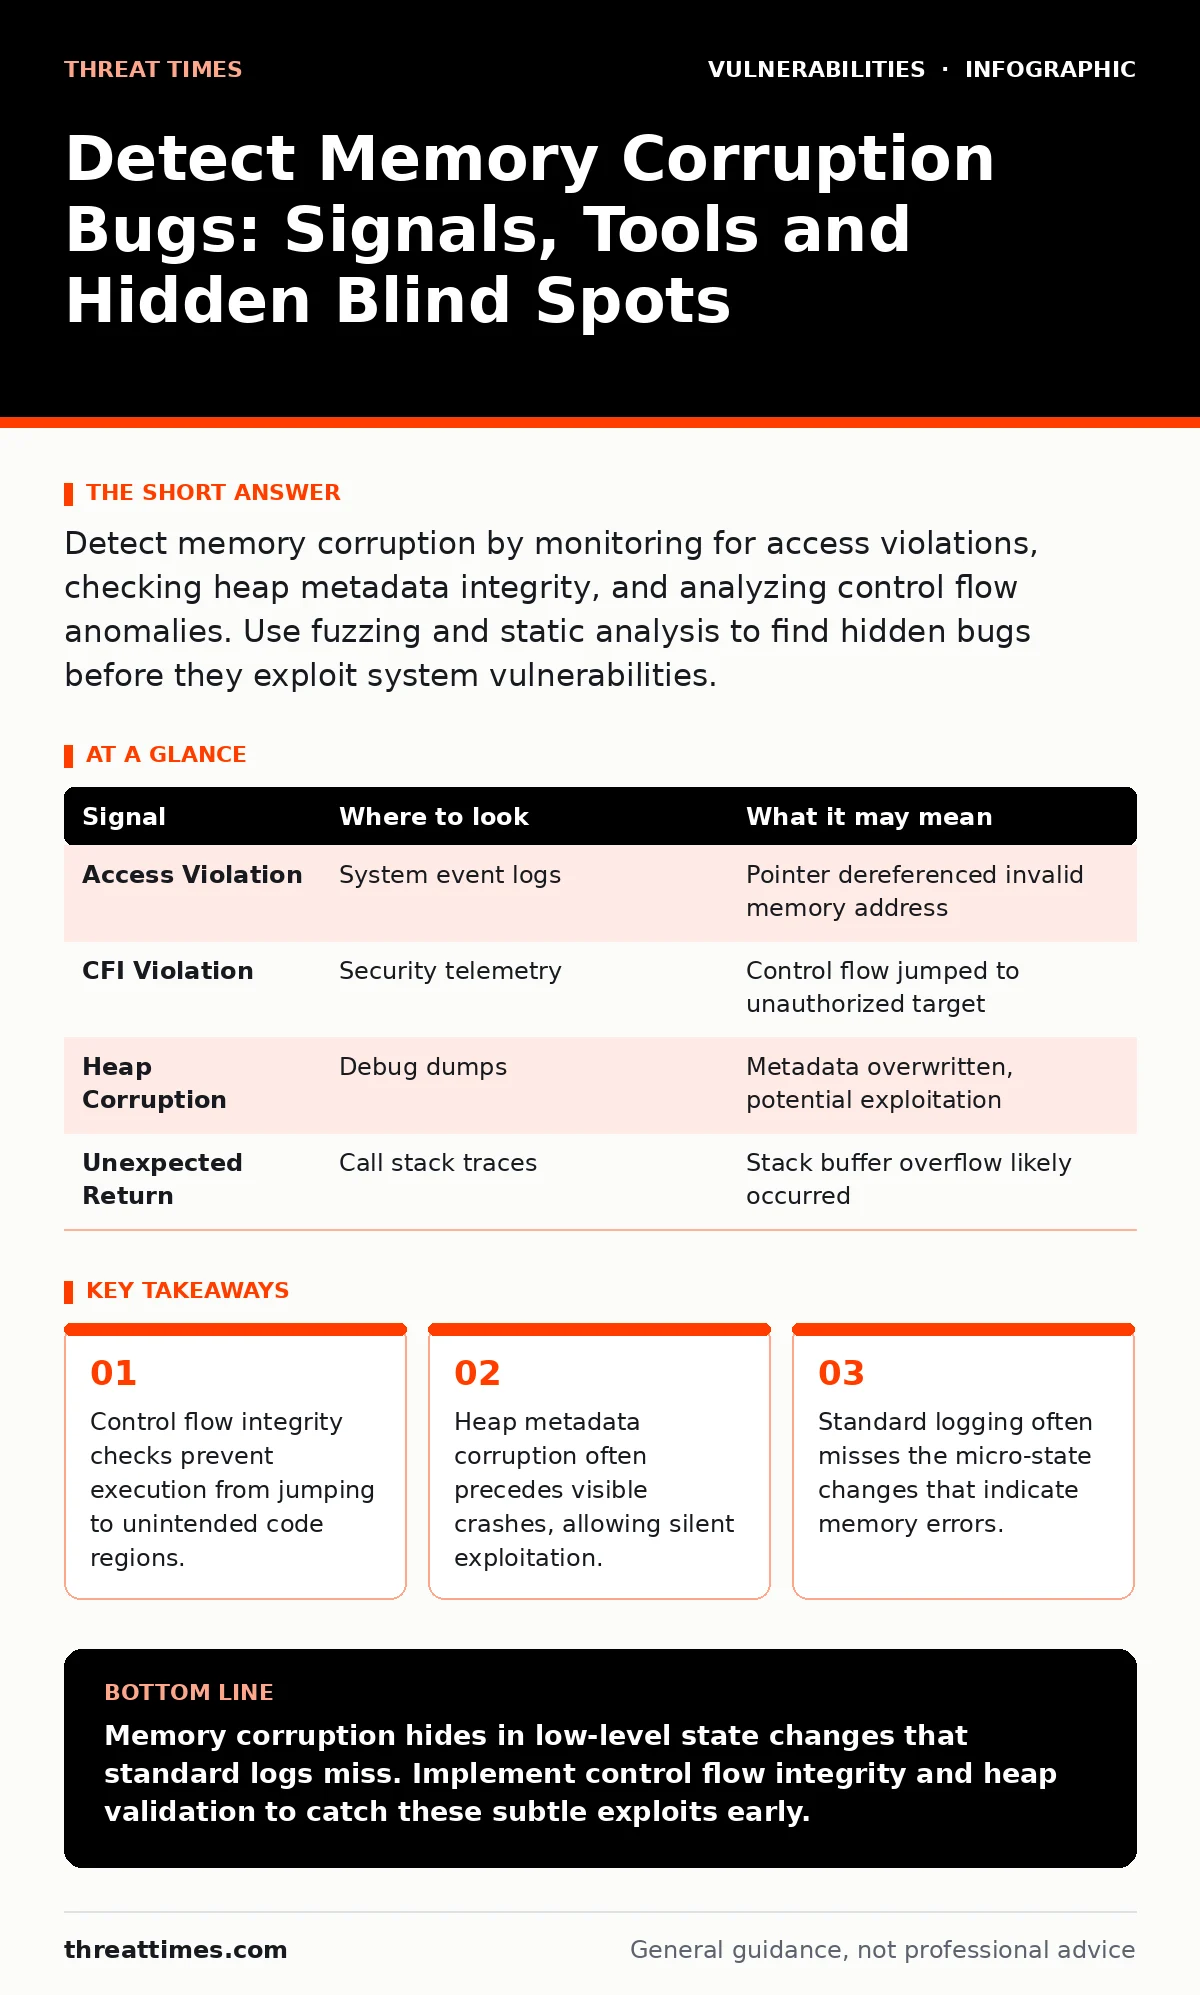
Detect memory corruption by monitoring for access violations, checking heap metadata integrity, and analyzing control flow anomalies. Use fuzzing and static analysis to find hidden bugs before they exploit system vulnerabilities.
Control Flow Anomalies
Memory corruption bugs allow an attacker to overwrite data in a program's memory space. This often leads to control flow hijacking, where the program executes instructions from an unintended location. You must monitor for deviations in the expected execution path. Standard logs rarely capture the exact moment of corruption. Instead, look for sudden jumps in function call stacks or unexpected return addresses.
Control Flow Integrity (CFI) is a security mechanism that ensures a program follows its intended execution graph. It restricts indirect calls and jumps to only those targets predefined by the developer. When CFI detects a violation, it typically terminates the process immediately. This prevents the attacker from gaining persistent access. Without CFI, a corrupted return address might lead to silent code execution that blends into normal traffic.
Heap Metadata Integrity
The heap is a region of memory used for dynamic allocation during program execution. Programs manage this space using metadata, which tracks the size and status of each allocated block. If an attacker overwrites this metadata, they can manipulate how the allocator behaves. This can lead to use-after-free conditions, where a program accesses memory that has already been released.
You can detect this by monitoring for allocation errors or unexpected heap states. Tools that validate heap integrity can spot these inconsistencies before they are exploited. Look for logs indicating double-free attempts or invalid pointer dereferences. These signals often appear as cryptic error codes rather than clear security alerts.
| Signal | Where to look | What it may mean |
|---|---|---|
| Access Violation | System event logs | Pointer dereferenced invalid memory address |
| CFI Violation | Security telemetry | Control flow jumped to unauthorized target |
| Heap Corruption | Debug dumps | Metadata overwritten, potential exploitation |
| Unexpected Return | Call stack traces | Stack buffer overflow likely occurred |
Static and Dynamic Analysis
Static analysis examines source code without executing it. It looks for patterns that commonly lead to memory errors, such as unchecked buffer sizes. Dynamic analysis, or fuzzing, involves feeding malformed inputs to a running program. This triggers hidden bugs that static checks might miss. Fuzzing is particularly effective for finding edge cases in complex input parsers.
Combine both methods for deeper coverage. Static tools reduce the search space by highlighting risky code regions. Fuzzers then target these areas with random or structured inputs. This approach reveals bugs that only manifest under specific timing or state conditions. It requires significant computational resources but provides high confidence in code safety.
Runtime Protection Mechanisms
Address Space Layout Randomization (ASLR) randomizes the memory locations of key program components. This makes it harder for attackers to predict where code or data resides. Data Execution Prevention (DEP) marks certain memory areas as non-executable. This prevents code injection attacks from running malicious payloads directly in data regions.
However, these protections have limits. ASLR can be bypassed if an attacker finds a memory leak that reveals base addresses. DEP can be circumvented by hijacking existing executable code, a technique known as Return Oriented Programming. You must monitor for information leaks and unusual code reuse patterns. Relying solely on ASLR and DEP leaves you vulnerable to advanced exploitation techniques.
Log and Telemetry Gaps
Standard application logs often lack the granularity needed to detect memory corruption. They record high-level events, such as login attempts or file accesses. They do not track memory state changes or pointer validity. This creates a blind spot where corruption can occur and persist without triggering alerts. You need specialized telemetry that captures low-level system events.
Instrument your applications to log memory allocation and deallocation events. Include pointer values and metadata in these logs when possible. This allows you to reconstruct the state of memory at the time of a crash. Without this data, root cause analysis becomes guesswork. You may miss the connection between a minor error and a major security breach.
Common Blind Spots
One major blind spot is global state corruption. Attackers often target global variables to alter program behavior subtly. These changes do not always cause immediate crashes. Instead, they lead to logic errors that are hard to trace. Another blind spot is race conditions in multi-threaded programs. These can cause memory corruption that only appears under specific timing conditions.
Static analysis tools often struggle with multi-threaded code. They may miss race conditions that dynamic testing also overlooks due to timing variability. You must use specialized thread sanitizers to detect these issues. Additionally, legacy code often lacks modern memory safety features. Refactoring this code is difficult, so extra monitoring is required.
Integration with Security Frameworks
Memory corruption vulnerabilities are closely related to integer overflow vulnerabilities. An integer overflow can cause a buffer to be allocated incorrectly, leading to memory corruption. You should treat these issues as part of a broader input validation strategy. Secure input handling reduces the attack surface for both types of bugs.
Additionally, these bugs can exacerbate insecure deserialization risks. If an attacker can control the memory layout, they may influence how objects are reconstructed. Combining static analysis with runtime protection provides a layered defense. This approach addresses both the cause and the effect of memory errors.
Key takeaways
- Control flow integrity checks prevent execution from jumping to unintended code regions.
- Heap metadata corruption often precedes visible crashes, allowing silent exploitation.
- Standard logging often misses the micro-state changes that indicate memory errors.
Memory corruption hides in low-level state changes that standard logs miss. Implement control flow integrity and heap validation to catch these subtle exploits early.
Frequently asked questions
How do I distinguish a memory corruption bug from a simple application crash?
Memory corruption often shows specific patterns like invalid pointer addresses or heap metadata errors, whereas simple crashes may stem from logic errors or resource exhaustion.
Can static analysis alone prevent all memory corruption vulnerabilities?
No, static analysis may miss runtime-specific issues like race conditions or complex state interactions that only occur during execution.
What is the role of fuzzing in detecting memory bugs?
Fuzzing triggers hidden bugs by sending malformed inputs, revealing vulnerabilities that static checks and manual testing often miss.
How do control flow integrity checks work in practice?
CFI restricts indirect jumps and calls to predefined targets, terminating the program if execution deviates from the expected path.
How this guide was produced: written by the Threat Times editorial team with AI assistance, checked against the public references listed below, and reviewed when the facts change. See our editorial policy or report an error.