Grafana Labs adds Knowledge Graph to Cloud stacks for incident context
Grafana Labs embeds a Knowledge Graph in every Cloud stack to link infrastructure, apps, and user experience for faster incident response.
Key points
- Grafana Labs announced a Knowledge Graph in every Grafana Cloud stack alongside new Digital Experience Monitoring capabilities.
- The release updates Grafana Cloud Incident Response Management to connect technical symptoms with business impact for agents and teams.
- A 2026 State of Observability Report found that 30% of surveyed leaders can explain issues but cannot prevent them before users are affected.
Grafana Labs announced the addition of a Knowledge Graph to every Grafana Cloud stack this week, alongside new Digital Experience Monitoring capabilities and updates to its Incident Response Management platform. The company stated these releases connect infrastructure and application dependencies with user experience data, providing shared context for both human operators and automated agents to investigate problems and take action.
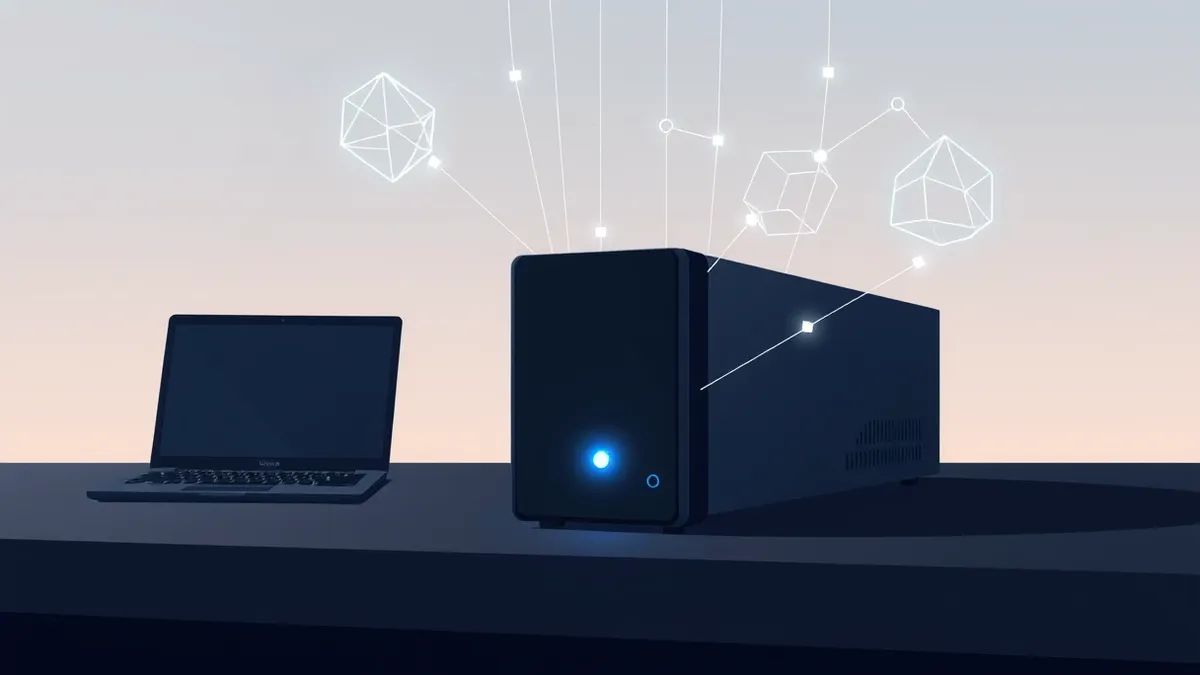
According to Help Net Security, the new features aim to bridge the gap between technical telemetry and business impact as agentic systems become more architecturally complex. The Knowledge Graph serves as a runtime context layer within Grafana Cloud, allowing teams to curate what their agents know about their environment. This model links infrastructure, applications, and user-facing signals, helping users trace symptoms across dependencies to identify root causes more efficiently.
Context from industry survey
Grafana Labs and ETR, a Futurum company, released the 2026 State of Observability Report alongside these product updates. The survey of 300 IT and engineering leaders revealed that 30% operate at a maturity stage where they can explain unexpected system behavior but cannot detect and prevent issues before they affect users. This statistic highlights a common gap in current observability practices, where teams possess data but lack the connected context needed for proactive prevention.
Richard Lam, Director of Product at Grafana Labs, stated that most teams face a technology debt problem rather than a monitoring problem. He noted that organizations often have telemetry from every layer but lack the ability to connect that data to the specific customer it affects. By embedding the Knowledge Graph in every stack, Grafana Labs aims to make unified observability foundational, reducing the need for teams to assemble these connections manually.
Who is affected
The updates target organizations using Grafana Cloud for full-stack observability. According to the source material, the solution is built on open standards, meaning it works with agents teams already use, not only those provided by Grafana. This approach allows existing workflows to integrate with the new context layer without requiring a complete overhaul of current tooling or agent deployments.
Teams that rely on agentic systems to investigate and respond to problems will find the new context layer particularly relevant. As these systems grow in complexity, they require clear connections between technical symptoms and business outcomes. The Knowledge Graph provides this link, enabling agents to understand how a failing database impacts specific services, teams, and customers.
What should you do?
Organizations should review their current observability stacks to identify gaps in runtime context between infrastructure and user experience. Security and engineering leaders should assess whether their existing agents can leverage open-standard connections to improve incident response times. Teams should also evaluate their maturity in detecting issues before they impact users, using benchmarks like the 2026 State of Observability Report.
What to do and how to stay safe: Grafana Labs
- Audit current telemetry pipelines to ensure data from infrastructure, applications, and user browsers is collected and stored.
- Evaluate existing incident response workflows to determine if agents or humans lack context connecting technical symptoms to business impact.
- Review vendor documentation for open-standard compatibility to ensure new observability tools integrate with current agents and systems.
- Benchmark your team's observability maturity against industry reports to identify gaps in detection and prevention capabilities.
Step-by-step guide: Cloud Misconfiguration Response: Containment, Recovery and Prevention Steps
General security guidance from the Threat Times newsroom. It is not confirmed advice from the organisations named in this story.
Frequently asked questions
What is the Grafana Cloud Knowledge Graph?
It is a runtime context layer in every Grafana Cloud stack that links infrastructure, applications, and user-facing signals into a shared model for investigating issues.
How many leaders were surveyed for the 2026 State of Observability Report?
The report surveyed 300 IT and engineering leaders, finding that 30% can explain system behavior but cannot prevent issues before users are affected.
Does the new Knowledge Graph work with third-party agents?
Yes, according to Grafana Labs, the solution is built on open standards and works with the agents teams already use, not only Grafana’s own agents.